

"Visual content” is the hot new term in content marketing. But what does it really mean, and how can you use it to your advantage? Check out this SlideShow t...

|
Scooped by Beth Kanter |

Get Started for FREE
Sign up with Facebook Sign up with X
I don't have a Facebook or a X account


 Your new post is loading...
 Your new post is loading...
Your new post is loading...
"Visual content” is the hot new term in content marketing. But what does it really mean, and how can you use it to your advantage? Check out this SlideShow t...
|
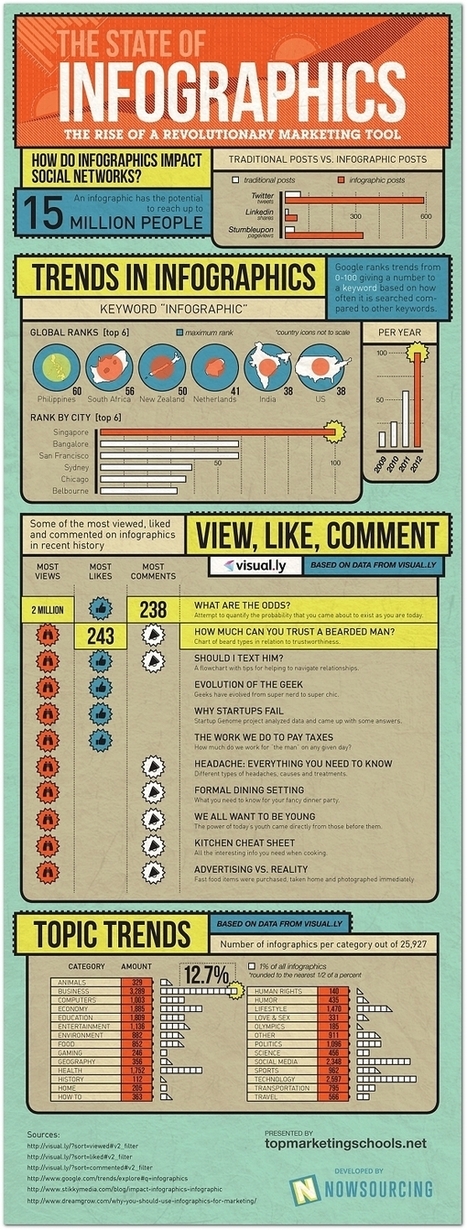
It turns out 2012 was a huge year for the infographic—internet culture likes its data presented with charming representative imagery. Business, technology, and social media comprised the most popular topics for this exploding medium, according to data, Singapore searched the term “infographic” more than any other global city. Via Lauren Moss
|


Great overview of visual content from Column Five. What is visual content, what's the ROI, why does it matter?
The Taxonomy of Visual Content slide is particularly useful.