

A guide to creating accurate and effective charts and graphs, with a checklist of the most common errors and how to avoid them.
Get Started for FREE
Sign up with Facebook Sign up with X
I don't have a Facebook or a X account


 Your new post is loading...
 Your new post is loading...
Your new post is loading...
A guide to creating accurate and effective charts and graphs, with a checklist of the most common errors and how to avoid them. 

Jim George's curator insight,
September 1, 2016 9:59 AM
Some excellent tips to spruce up the old visuals!

La pluma digital's curator insight,
October 31, 2016 10:12 AM
Una guía para elaborar gráficos no solo fáciles de leer, sino también atractivos para el usuario.

Lilydale High School's curator insight,
December 28, 2016 5:53 AM
Chart making.
Sign up to comment
You'll most likely have to enter charts for a presentation. You can either use one you already have in Excel or create one manually on the fly right in PowerPo…
Baiba Svenca's insight:
A great tutorial on how to create charts in PowerPoint by linda.com. There are two effortless ways of doing it as demonstrated in this tutorial.
From
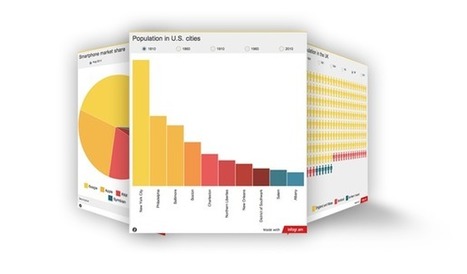
infogr

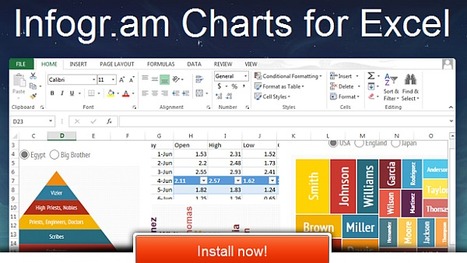
Create infographics and interactive online charts. It's free and super-easy! Follow other users and discover amazing data stories!
Baiba Svenca's insight:
Infogr.am now enables you to create interactive charts and infographics in Excel to visualize your information. You will need Microsoft Office 2013 to use this free application.

Sarah Bylsma's curator insight,
July 27, 2013 10:19 PM
Great cross literacy tool (geography,math etc.) I can't wait to share with my tweets
Create, embed and share your charts, plots, diagrams and maps online.
Baiba Svenca's insight:
Chartle is a free interactive chart creation tool using Java which works online, you don't need to download it. No registration. When your chart is ready, you can publish it or embed it on your website. Because of its simplicity, it is great for using with students.

Christine Bushong's curator insight,
March 19, 2013 9:25 AM
Free. No registration. Publish or embed.

iCharts accelerates data storytelling with simplistic, interactive, visualization tools for big and small data providers.
Baiba Svenca's insight:
iCharts helps you make great-looking charts quickly and easily. Load your data from multiple sources, design and publish your chart. To learn how to use iCharts, watch User Guide http://www.icharts.net/user-guide Basic account is free.

Sue Gould's curator insight,
March 6, 2013 6:34 PM
There is an emerging learning trend towards visual stimulus as a result of growing up with videos, TV, and technology from barbie laptops to Ipads. This is a great resource for tutors to reach this audience while using few words. 
Robert Sims's curator insight,
March 15, 2013 5:07 PM
Here's a great tool for building up the Taxonomy usage in your classroom!

Idea Sketch lets you easily draw a diagram - mind map, concept map, or flow chart - and convert it to a text outline, and vice versa. You can use Idea Sketch for anything, such as brainstorming new ideas, illustrating concepts, making lists and outlines, planning presentations, creating organizational charts, and more!
Baiba Svenca's insight:
Idea Sketch is an app that helps you to create graphical outlines of your ideas or plans. Free download https://itunes.apple.com/us/app/idea-sketch/id367246522?mt=8&affId=1822652
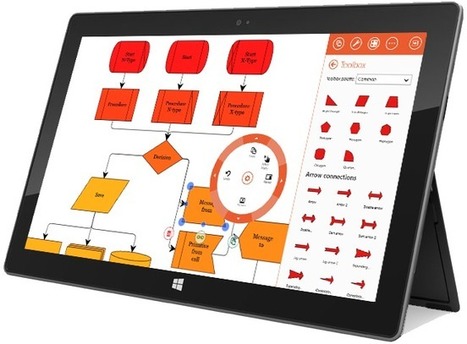
Grapholite is an easy-to-use and still comprehensive online solution to design professional-looking flowcharts, organizational charts, mind maps, Venn charts, database structures, web-site structures, etc. that can be used online and offline, in and out of browser; created diagrams can be stored locally and on the server.
Supports IE, Chrome, Firefox and Safari on Mac, WinXP, Win7 and Win8.
Baiba Svenca's insight:
To test the tool, you can use demo mode. The tool produces beautiful and detailed mind maps and diagrams.

Janek Wagner's comment,
December 12, 2012 3:28 AM
LOL: This application requires you to update your browser with the Microsoft Silverlight plug-in.

Create enjoyable and captivating Flash Charts from your web browser for Free. Rich Chart Live transforms your data into enjoyable and captivating communication. All you need is a web browser, no software to download, nothing to install.
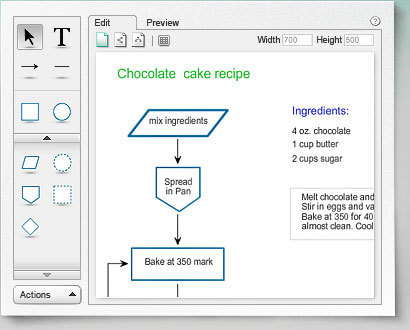
FlowChart is another free tool that you can use to make online diagrams and then share online with your colleges...

Progressive training's curator insight,
October 29, 2013 8:14 AM
Free tool to make diagrams online
#presentations
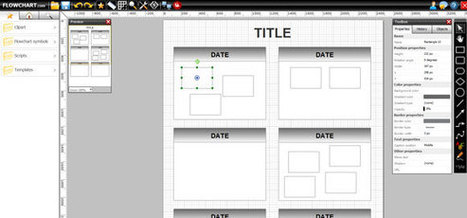
Lovely Charts is an online diagramming application that allows you to create professional looking diagrams, such as flowcharts, sitemaps, organisation charts, wireframes, and many more...
From
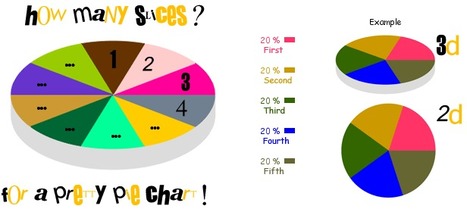
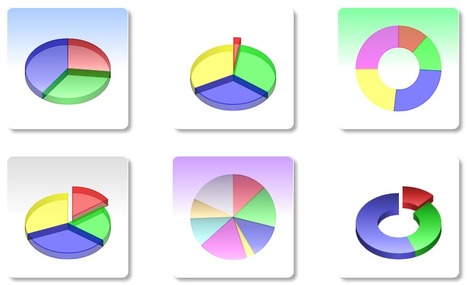
piecolor
A simple tool that creates color pie chart. This generator will produce an image that you can download.
My.origramy is online service helping you create complex diagrams, schemes, presentations, charts, graphs fast. It uses flash technology to help reach all pluses of vector technique.
|

Adding data to PowerPoint isn’t as easy as it sounds. Let’s go over how to add interactive Infogram charts to PowerPoint Online in 5 easy steps:
Baiba Svenca's insight:
PowerPoint + Infogram + OneDrive

"Through the Free Technology for Teachers Facebook page I recently received a request for some suggested online chart creation tools..."
Baiba Svenca's insight:
Once again, here is a list of online tools for creating charts and diagrams compiled by Richard Byrne. You may discover a new tool unknown to you before.

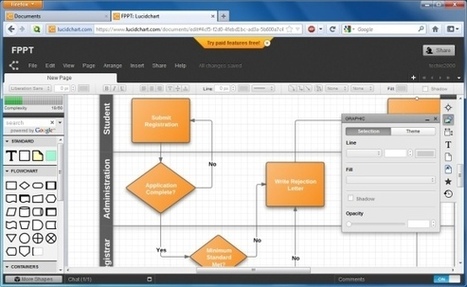
Gust MEES's curator insight,
February 11, 2015 11:13 AM
Lucidchart is an easy tool to use to create flowcharts, mindmaps, and graphic organizers. Lucidchart offers a simple drag and drop interface for creating flow charts, organizational charts, mind maps, and other types of diagrams. To create with Lucidchart just select elements from the menus and drag them to the canvas. You can re-size any element and type text within elements on your chart. Arrows and connecting lines can be re-sized, repositioned, and labeled to bring clarity to your diagrams. Find out more tools by visiting the article...

Polychart is a free web service that lets you easily create Dashboards and charts from your existing database. It conveniently connects directly to where you store your data and works in browsers and on tablets so you can create charts and diagrams anywhere you are. You can also export your charts to PowerPoint, PDF and image formats.
Baiba Svenca's insight:
Read the review of Polychart which is a tool that lets you create and customize charts from your own data. Export your charts to PowerPoint, download as image or PDF. Watch the demo video that explains how to use Polychart https://www.polychart.com/

Lynn M. Miller's curator insight,
June 22, 2013 12:15 PM
Great article! *Professionalism with a Flair! #lmallc 
Wayne Turner's curator insight,
June 23, 2013 11:08 AM
I'm always looking for ways to graphically present complex information.

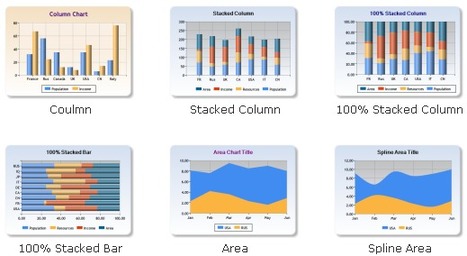
Charts are a great tool because they communicate information visually. On Onlinecharttool.com you can design and share your own charts online and for free. We support a number of different chart types like: bar charts, pie charts, line charts, bubble charts and radar plots.
Baiba Svenca's insight:
Chart Tool is the easiest and fastest web application for creating different charts to be used in your presentations. No registration is required. Build your chart and download it in various formats or send it to anyone by email. Chart tool is free to use.

Tom Perran's curator insight,
March 6, 2013 8:47 PM
Nice to have all of these different charts in one place.
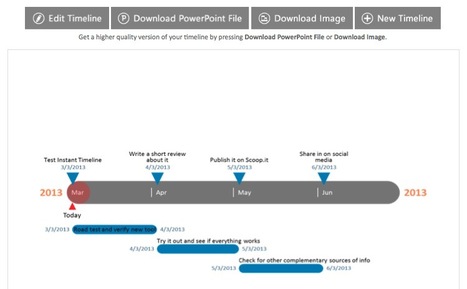
Office Timeline is a free timeline maker PowerPoint add-in that allows you to easily create and share beautiful simple timelines, gantt charts, and project schedules. Via Robin Good

John's curator insight,
August 22, 2013 9:47 AM
That is just very handy. Thanks for sharing this excellent tool! 
Margarita Parra's curator insight,
December 14, 2014 12:20 PM
Hay que probar esta nueva herramienta. La liga directa:https://www.officetimeline.com/download
![Lekh Diagram: Easily Create All Types Of Diagrams, Flow Charts, & Mind Maps [iPad] | Digital Presentations in Education | Scoop.it](https://img.scoop.it/92dDkaJ6m3ti2UPAU3_Ycjl72eJkfbmt4t8yenImKBVvK0kTmF0xjctABnaLJIm9)
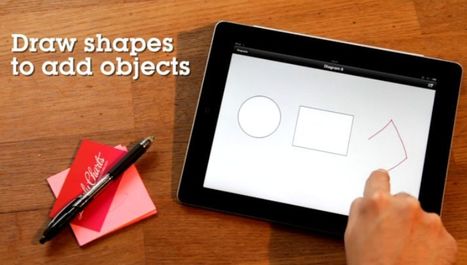
...Mostly people create these charts through computer applications. A few presenters use web applications since there has been a recent emergence of online diagram creators. But if you are always on the go and you need a highly accessible diagram creator, then you should go for the smart device application called Lekh Diagram.

Baiba Svenca's comment,
December 11, 2012 3:13 PM
This tool looks extremely friendly letting you draw a diagram or a mind map just using your finger, so if you have an iPad, give it a go!
Create a graph online quickly. Create bar graphs, line graphs or pie charts. Simply choose your settings, paste your data in the Chart data area and hit the create button. Visit the menu section if you need more specific chart settings.

From simple charts to complex maps and infographics, Brian Suda's round-up of the best – and mostly free – tools has everything you need to bring your data to life... A common question is how to get started with data visualisations. Beyond following blogs, you need to practice – and to practice, you need to understand the tools available. In this article, get introduced to 20 different tools for creating visualisations... Via Lauren Moss

Randy Rebman's curator insight,
January 28, 2013 12:33 PM
This looks like it might be a good source for integrating infographics into the classroom.
ChartsBin is a web-based data visualization tool that will allow everyone to quickly and easily create rich interactive visualizations with their own data... Download charts from the extensive chart library or create your own.
Lucid Chart is an online platform for creating powerful diagrams and flowcharts that can be used for creating presentations and for visual communication with your audience.
DIY Chart is a web-based, simple and powerful online tool to create interactive charts and graphs from static or dynamic data which may be generated using any scripting language. Free or paid accounts.
Infogr.am is a super-simple app to create interactive web-based infographics and charts.
|


Excellent tips for making charts that look professional.