Robin Good: StatSilk offers a set of free downloadable software tools to create professional-looking stat and trend charts.
StatPlanet can be used to create anything from basic interactive maps to advanced infographics.
StatTrends is tailored to create interactive graphs and charts.
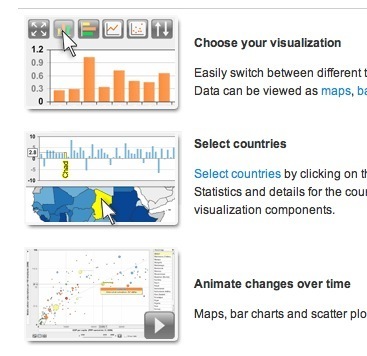
Key features include:
-> Multiple graphing and charting types
-> Select countries by clicking on them in the world map or country selection window. Statistics and details for the country selected are displayed inside popups and visualization components.
-> Animate changes over time
-> Zoom into map regions
-> Hide or reveal details - Change the level of detail by hiding or revealing interface components, country names or statistics.
-> Customize the colors and value ranges of maps
and graphs.
-> Export maps for use in other applications or publications.
Examples: http://www.statsilk.com/examples
Try free web-demo here: http://www.statsilk.com/software/stattrends
Features: http://www.statsilk.com/features
and here: http://www.statsilk.com/features#components
Downloads: http://www.statsilk.com/downloads (Win only)
Find out more: http://www.statsilk.com/


 Your new post is loading...


