Presentation Tools
195.1K views | +0 today
Follow
Presentation Tools
Tools and services to deliver your presentations: online and off
Curated by Robin Good
Your new post is loading...
Scooped by Robin Good
Scoop.it!

Make It Easy for Anyone To Connect To Your Projector via this WiFi box: Prijector

Robin Good's insight:


Prijector is a new hardware device that eliminates issues arising when different people, who have different computers and setups need to connect to a projector.


You know how the story goes. One guy forgets his VGA adapter cable. One another doesn't have a HDMI out plug. And so on.


Prijector solves the issue by acting as an intermediary between any computer wanting to present and the projector itself. You connect via WiFi to this device and that's it, you don't have to worry anymore about cables and plugs.


Therefore even if you have a conference with multiple presenters, each one of them only needs to connect to the Prijector WiFi access point to be connected to the projector.


Key advantages I see:

  • you don't have to worry about people having the proper cable or adapater to connect to the projector
     
  • you are not locked to be within cable length distance from the projector
     
  • you can easily switch from one presenter to another easily without flipping cables
     
  • you can provide local wifi access to the people attending


I haven't tried one but it looks useful.


Pre-launch pricing: $119 (later $199)


Find out more: http://prijector.com/ 


Scooped by Robin Good
Scoop.it!

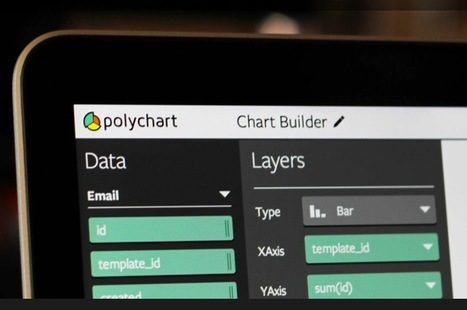
Create Professional Business Graphs from Your Database Data with Polychart

Create Professional Business Graphs from Your Database Data with Polychart | Presentation Tools | Scoop.it


Robin Good's insight:


Polychart is a web-based app which allows you to connect to your database data (MySQL, SalesForce, PostgreSQL, InfoBright) and to generate professional-looking charts and graphs that can be edited interactively and that can be extensively customized.


As far as source data is concerned, you can connect to any online MySQL, Salesforce, InfoBright or PostgreSQL database repository and connect directly to the existing data.


Once you have connected your database you can select which fields you want to be visualized and you can customize the type of chart (bar, line, scatter, area, tile and spline) and the individual elements that make it up.


Your final chart visualization can be easily exported to a PDF, PowerPoint, vector (.SVG) or image (.PNG) file.


Free to use.


Find out more: https://www.polychart.com/


No comment yet.