Presentation Tools
195.1K views | +0 today
Follow
Presentation Tools
Tools and services to deliver your presentations: online and off
Curated by Robin Good
Your new post is loading...
Scooped by Robin Good
Scoop.it!

A Simple Guide On How To Present Effectively in Public: Speaking.io

A Simple Guide On How To Present Effectively in Public: Speaking.io | Presentation Tools | Scoop.it
Robin Good's insight:


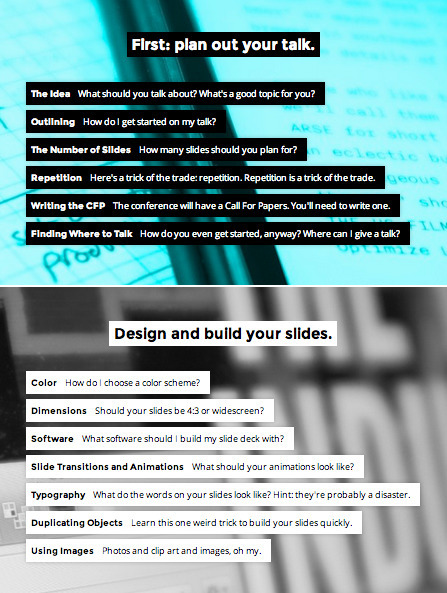
Speaking.io is a free web guide to how to present effectively in public curated by @Zach Holman, a subject matter expert, having spoken at a large number of conferences.


The Guide is elegantly organized in multiple sections, each containing a small set of more specific information chapters, and  all accessible from the home page index. 


Good resource for novice public speakers and presenters, as well as another great example of content curation at work. In this case the author has curated his know-how, notes and previous writings into one cohesive and well present gallery.


Helpful. Well designed. 8/10


Check it out now: http://speaking.io/ 


Follow Speaking.io on Twitter


via @Ana Cristina Pratas


Ana Sanchez's curator insight, April 29, 2014 4:51 PM

A very nice summary of all the points you need to think about when preparing a conference presentation. "Because “imagine everyone's naked” is terrible advice."

Alex's curator insight, August 1, 2016 10:51 PM
great point on reacting and reflecting after your presentations to improve for future :)
Lea Marucci's curator insight, October 27, 2017 10:30 PM
Inquiry Session 3: Delivering Presentations
Scooped by Robin Good
Scoop.it!

A Curated Collection of All the DataViz Methods: The Data Visualization Catalogue

A Curated Collection of All the DataViz Methods: The Data Visualization Catalogue | Presentation Tools | Scoop.it
If you've ever struggled with what visualization to create to best show the data you have, The Data Visualization Catalogue might provide just the help you
Robin Good's insight:


The Data Visualisation Catalogue is an on-going project developed by Severino Ribecca which attempts to index and catalogue all of the data visualization approaches available, in order to help journalists, designers and professional communicators identify more easily the type of data visualization most appropriate for their needs.

.

In the Catalogue there are now over 50 different data visualization approaches that have been identified, and about a third of them have also been documented with a basic description, visual examples, relevant tags to associate it with their possibe best uses, variations, and with a list of alternative tools available to create that type of data chart.

.

You can browse the catalogue also by using the "Search by Function" which is designed to aid in choosing the appropiate data visualization approach based on the specific communication need at hand, or with the "View by List" approach, which organizes dataviz methods by types. 

.

My comment: Excellent resource for visual communicators of all kinds as it helps you see the great variety of dataviz approaches available. It makes it easier to identify and select relevant solutions according to needs and use.

.

Check it out: http://blog.visual.ly/the-data-visualization-catalogue/ 

.

.


Hat Tip to @LelioSimi


Una Sinnott's curator insight, February 2, 2014 4:54 PM

A great collection of data visualisation tools, categorised by the characteristics of the data you want to show.

Juliana Elisa Raffaghelli's curator insight, February 19, 2014 7:14 AM

Rappresentare: raccontare la realtà in modo tale da attrarre in modo efficace l'attenzione del nostro interlocutore/lettore. In una società iperconnessa e dialogica, fondamentale competenza.